
The Volatility Action Plan
Over my 20-plus years analyzing the markets, I’ve uncovered dozens of profitable patterns and anomalies.
But I’ve never seen anything quite like what I’m about to share with you today.
It’s a strategy built around the market’s most predictable ticker symbol – one that’s been following the same repeatable pattern over and over for more than three decades.
Now, through rigorous backtesting on 25 years’ worth of market data, I’ve cracked the code on how to profit from these moves consistently.
The results speak for themselves: an 80% historical accuracy rate with average maximum gains of 78% in just eight days…
Individual peak wins as high as 243% in 14 days…
And − perhaps best of all – you never have to predict which direction the market will move.
You simply wait for volatility to spike, and then you profit as it inevitably returns to normal.
After all, that’s what volatility always does. It spikes… and then it reverts.
Wash. Rinse. Repeat.
The VIX: Wall Street’s Fear Gauge
Before we dive into the strategy, let me explain what this shockingly consistent ticker is and how it works.
The CBOE Volatility Index – better known as “the VIX,” after its ticker symbol – was created by the Chicago Board Options Exchange in 1993. It’s often called Wall Street’s “fear gauge” because it measures expected market volatility over the next 30 days.
It calculates this by analyzing the prices of S&P 500 options (both calls and puts) that are between 23 and 37 days from expiration. These prices are weighted across various strike prices to create a forward-looking volatility forecast.
Here’s what you need to understand…
When the VIX is high, investors are nervous. They’re anticipating big market swings ahead, so they’re paying premium prices for options in order to protect their portfolios.
When the VIX is low, investors feel confident. They see smooth sailing ahead and don’t feel the need to pay up for protection.
The VIX spikes during times of economic uncertainty, geopolitical tensions, or major market disruptions. It falls during periods of calm when investors feel secure.
And here’s the key insight that makes this strategy work…
The VIX always returns to its average.
Unlike a stock, which can rise indefinitely as a company grows, the VIX is bounded by human nature itself. Fear cannot stay elevated forever. Panic always subsides. Confidence always returns.
Since its inception, the VIX has maintained a long-term average of around 19.6. It spiked as high as 80 during the 2008 financial crisis and the 2020 COVID crash. It has dropped as low as 9 during periods of extreme market confidence.
But every single time – with zero exceptions – it has returned to that average of 19.6.
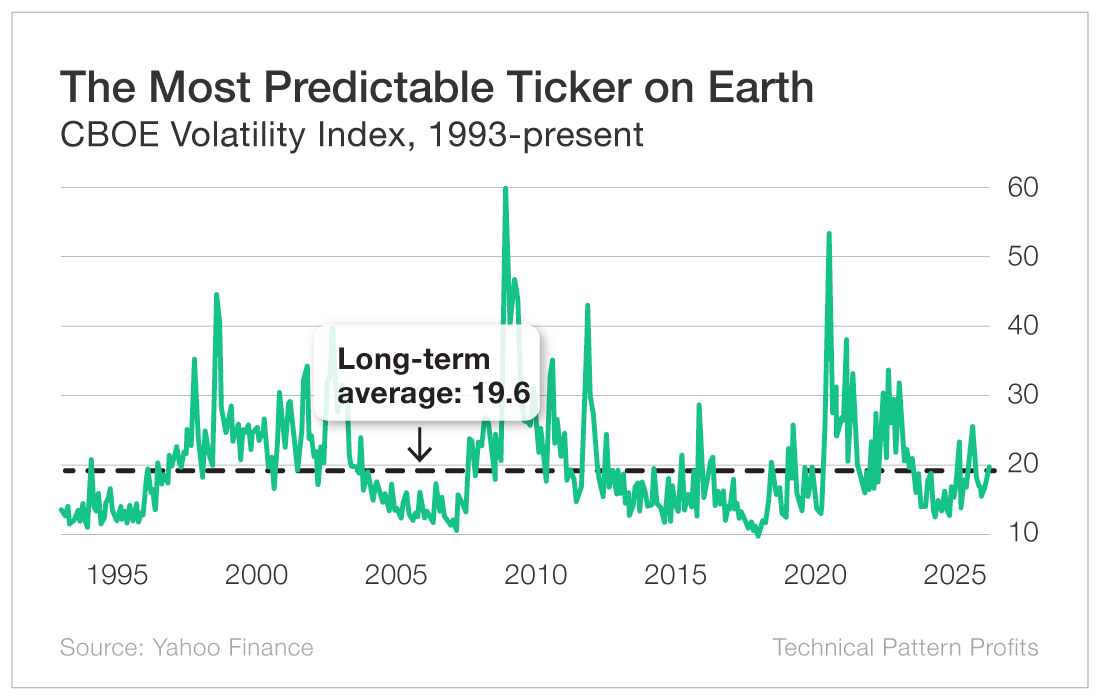
This isn’t speculation. It’s a mathematical certainty.
The VIX measures emotion. And emotions, by their very nature, are temporary.
Now, you might be thinking, “If the VIX always returns to 19.6, why not just wait for it to spike above that level and place a trade?”
If so, you’re not alone. Many sophisticated traders have tried this exact approach over the years.
The problem? It doesn’t work very well.
When we backtested this strategy, we found that it only generated about two tradeable opportunities per year. The VIX simply doesn’t experience enough significant spikes above its long-term average.
Why? Because the long-term average has been artificially elevated by extreme events like the financial crisis and the COVID crash. These massive spikes pushed the long-term average higher than where the VIX typically trades day-to-day.
So waiting for big moves relative to the long-term average meant missing most of the action.
That’s when my team and I went back to the drawing board.
After analyzing 25 years of daily VIX data – over half a million data points – we made a critical discovery that multiplied the number of tradeable setups per year by more than 16X.
A Lean, Mean-Reverting Machine
As I said above, the VIX always reverts to its long-term average of 19.6. But that’s not all. It’s also constantly reverting to various short-term averages.
Shorter time frames capture the current market environment much more accurately, because the average adapts quickly to changing conditions and isn’t artificially inflated by isolated events that occurred years ago.
Think of it this way: If you’re trying to determine whether it’s hot today, you don’t scour decades’ worth of meteorological data to compare today’s temperature with the long-term average. You just compare it with what’s been normal for the past few weeks.
The same logic applies to volatility.
After testing numerous different time frames, my team found that focusing on the 20-day moving average instead of the long-term average increased our number of trade setups from two per year to 33 per year.
But we didn’t stop there.
To make this strategy even more precise, we incorporated a statistical concept called standard deviation.
Standard deviation measures how much a value typically moves away from its average within a given time frame. In our case, we calculate the standard deviation of the VIX over rolling 20-day periods.
This allows us to determine not just whether the VIX is above or below its recent average, but also how far. That distance from the average is measured by the number of standard deviations, which is also called the “Z-score.”
To be clear, you’ll never have to do these calculations yourself. I’ll do all the heavy lifting and simply tell you what trade I’m recommending and how much to pay. But if you’re curious, calculating the Z-score of the VIX is actually quite straightforward:
Z-Score = (Current Value of the VIX – 20-Day Average) / 20-Day Standard Deviation
Suppose the VIX’s average over the last 20 days was 18.0 and its standard deviation over that span was 2.0. If the VIX were at 21 today, its Z-score would be:
(21 – 18) / 2 = 1.5
A Z-score of 1.5 tells us that the current VIX reading is 1.5 standard deviations above its recent average. In statistical terms, this is significant, as it means the VIX is well above its normal trading range. In fact, we’d expect it to spike that high less than 7% of the time.
Just as we did with the time frames, my team and I backtested numerous different Z-scores, and we found that using a Z-score of 1.5 generated the best results.
In plain English… When the Z-score of the VIX reaches 1.5 or higher, we know − with a high degree of confidence − that a reversal is coming.
Why? Because the VIX has strayed too far from recent norms. Investors’ fear has spiked to unusually high levels − and history tells us that this kind of elevated fear never lasts.
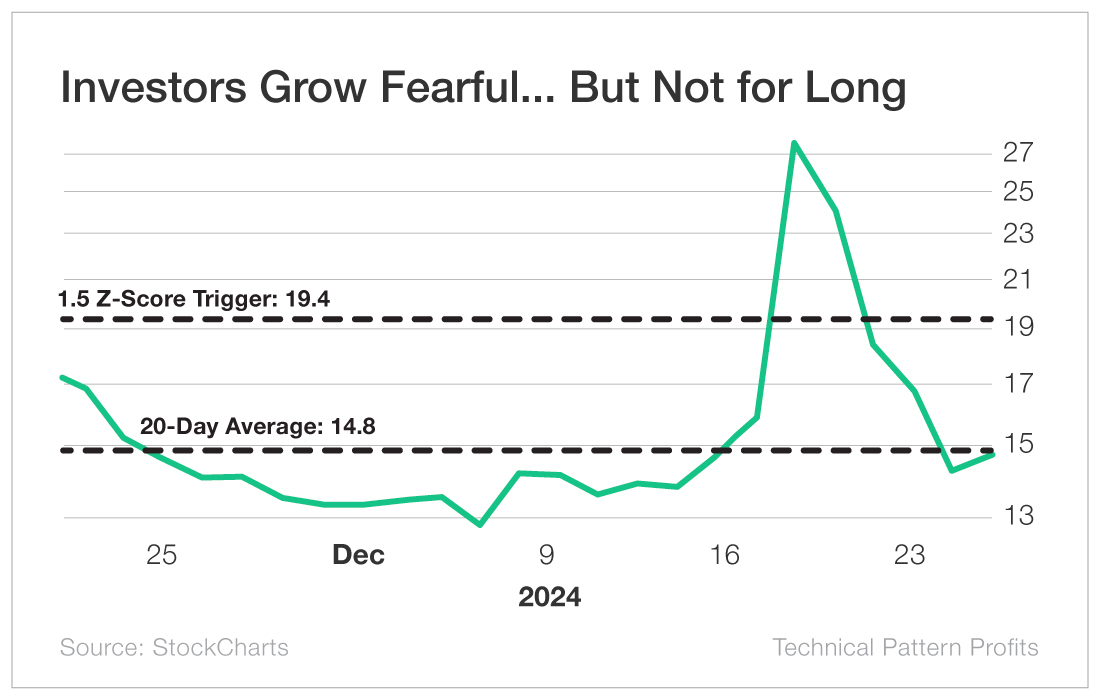
Just look at this example from December 2024. The VIX’s average over the previous 20 trading days was just 14.8. When it soared past our 1.5 Z-score trigger and reached 27.6 on December 18, our system would’ve indicated that a reversal was likely.
A mere four trading days later, the VIX was back around 14.
This Z-score approach gives us a mathematically sound entry point. We’re not guessing. We’re not relying on gut feel. We’re using cold, hard statistics to identify when the market is overreacting.
And when we get the green light… we pounce.
The Ticker That Makes It All Possible
There’s one more aspect of this strategy that you should be aware of.
Because the VIX is an index, you actually can’t trade it directly like you can with stocks.
However, there are several ways to gain exposure to the VIX’s movements.
After extensive testing, I found that the most effective way to profit from the predictable reversals in the VIX is through a fund called the ProShares Ultra VIX Short-Term Futures ETF (BATS: UVXY).
Let me explain what UVXY is and why it’s perfect for our strategy.
First of all, UVXY is a leveraged ETF that provides 1.5X exposure to short-term VIX futures. Generally speaking, when the VIX spikes, UVXY spikes even harder. And when the VIX falls, UVXY falls even harder. (Note: It’s just a coincidence that our ideal Z-score signal and the amount of leverage in UVXY are both 1.5. The two are unrelated.)
But there’s another advantage that makes UVXY even more attractive: structural decay.
You see, UVXY doesn’t track the VIX itself. It tracks VIX futures contracts. The key thing to know about these futures contracts is that the ones that expire further out in time are typically more expensive than the ones that expire sooner.
Every day, UVXY has to “roll” its holdings – selling the cheaper, near-term contract and buying the more expensive, longer-term contract. It’s essentially forced to sell low and buy high day after day after day.
This creates an inherent and constant downward pressure on UVXY’s price, even when the VIX itself is flat.
For us, this is perfect. We’re betting on UVXY to fall, and this structural decay works in our favor.
Since we’re betting on the VIX and UVXY to fall, we’ll be buying put options on UVXY. Most of the time, we’ll be buying puts that expire in two to three weeks and are at or slightly out of the money.
Now, there are a few caveats with options. They can (and sometimes do) expire worthless, so you should never invest more than you can afford to lose. My rule of thumb is to never risk more than 1% of your capital on any single options trade. So if you have $100,000 dedicated to your investments, that means risking no more than $1,000 per trade with this strategy.
That being said, the benefits of options are that they amplify your wins and limit the amount of money you have at stake, which is critical when you’re trading volatility.
That brings me to the final benefit of UVXY: It has a highly liquid options market with tight bid-ask spreads. This means we can get in and out of positions quickly and efficiently. UVXY also offers weekly options, which is perfect for capturing these short-term moves. (If you’re new to options or you’d like a refresher, check out my three-part Options Master Class video series.)
A Real-World Example: August 2025
On August 1, 2025, President Trump announced a new slate of tariffs and the government released disappointing employment data, sending shockwaves through the market. The VIX jumped from below 17 to over 20 overnight.
Our system would’ve triggered as the VIX’s Z-score reached 3.29, well above our 1.5 threshold.
At that point, you could have purchased UVXY $17 put options expiring two weeks later for about $1.23, or $123 per contract. (Remember, each option contract gives you control over 100 shares.)
Let’s say you bought 10 contracts for a total investment of $1,230.
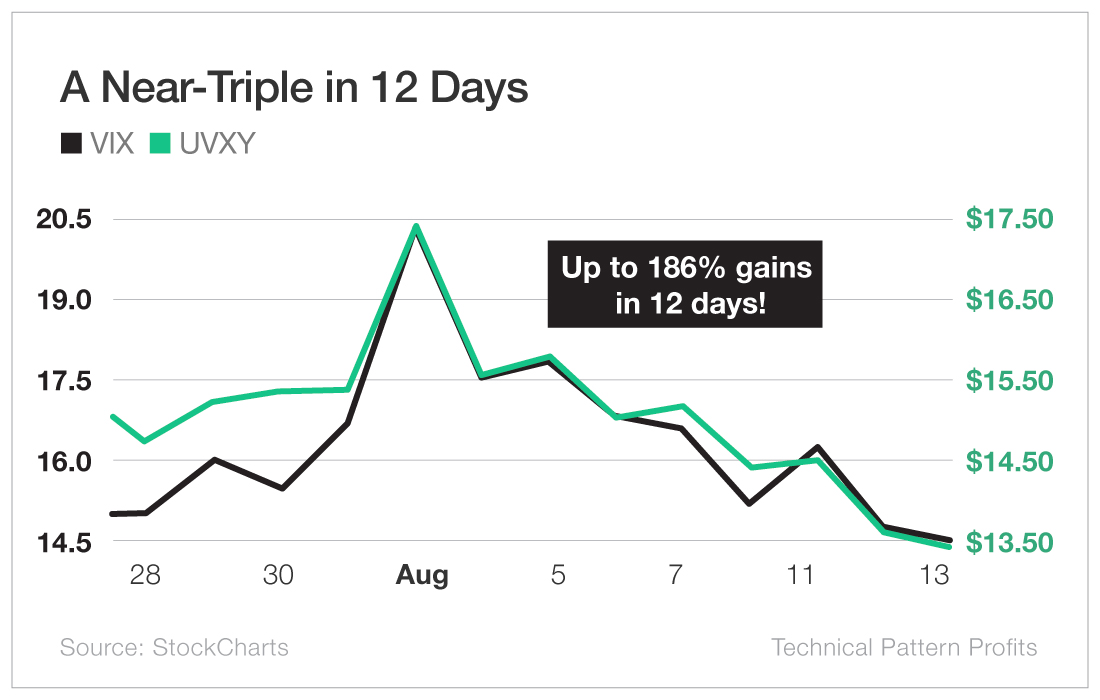
Over the next week, as investor fear subsided, the VIX began its inevitable reversion and UVXY started falling.
By August 13 – just 12 days later – the VIX had dropped back to around 14.5, UVXY had dropped from above $17 to $13.50, and the $17 puts had nearly tripled from $1.23 to $3.52.
That’s a profit of $229 per contract, or $2,290 for your 10 contracts.
In other words, you would’ve turned $1,230 into $3,520 in 12 days – a 186% gain.
Of course, one example doesn’t prove a strategy. What matters is consistency over time.
The Historical Performance: 25 Years of Data
As I said before, we left no stone unturned in our research. We spent months backtesting this approach across 25 years of market history.
Here’s what we found:
- 839 total buy signals over 25 years (approximately 33 per year)
- 80% accuracy rate when targeting short-term reversions
- Average peak gain of 78% per trade
- Average holding period of just eight days.
The strategy worked in both bull markets and bear markets… it worked during periods of high volatility and low volatility… and it worked through the dot-com crash, the 2008 financial crisis, the 2020 COVID crash, and everything in between.
Why? Because human psychology doesn’t change. Fear spikes. Fear subsides. The pattern repeats.
In one 12-month span, we found an incredible 12 trades with the potential to double our initial investment:

Now, let me be crystal clear: These are peak potential returns based on perfect timing. In real trading, you won’t hit the exact top and bottom every time. Some trades will be losers. That’s why our backtesting shows an 80% accuracy rate, not 100%.
Still, these numbers are extremely compelling. This is the power of combining VIX mean reversion with leveraged ETF options.
How to Execute the Strategy
Let me walk you through the exact process you’ll follow each time I send you a trade alert.
Step 1: Wait for the Signal
I monitor the VIX daily, calculating its 20-day moving average, 20-day standard deviation, and Z-score. When the Z-score reaches 1.5 or higher, I know a trading opportunity has arrived.
Step 2: Receive the Alert
When that happens, I’ll immediately send you an email containing the following information:
- The current level of the VIX
- The specific UVXY put option to buy (strike price and expiration date)
- The maximum price you should pay (the “buy up to” price)
- Anything else you’ll need to know to have the best possible chance of profiting on the trade.
Step 3: Place Your Trade
Log in to your brokerage account and place an order to buy the specified put option on UVXY. I recommend using a limit order at or below the “buy up to” price to ensure you get a good fill.
Most trades can be executed in 60 seconds or less once you’re familiar with the process.
If you miss an alert or your order doesn’t get filled, DO NOT chase the trade. Just wait for the next opportunity. There will always be another VIX spike.
(In order to trade options, you’ll need what’s called “Level 2 approval” from your broker. The approval process is easy − you’ll simply fill out a form on your broker’s website indicating that you’re aware of and comfortable with the risks of trading options. You should be approved within a few days.)
Step 4: Exit on My Signal
When the reversal has run its course, I’ll send you another alert letting you know it’s time to close the position and take profits.
On average, you’ll be in these trades for about eight days. Some will be shorter, some longer. But the goal is always the same: Capture the reversion, bank the profit, and move on to the next opportunity. A disciplined exit strategy is essential − especially when you’re trading options. Don’t get greedy and hold on for more gains.
By the way, the VIX is just as predictable when it moves in the opposite direction. When it drops too low – below its short-term average – it will inevitably spike back up. We can trade these upside reversions too, using call options on UVXY instead of puts.
This gives us the ability to profit in any market environment. When fear spikes, we buy puts. When greed and complacency set in, we buy calls.
We’re not betting on market direction. We’re betting on a mathematical certainty: What goes up will always come down, and what goes down will always come up.
Why This Strategy Works (and Will Keep Working)
I’ve been analyzing markets for over two decades, and I’ve seen countless trading strategies come and go.
Most fail for one simple reason: They rely on patterns that eventually break down as more people discover them.
But this VIX strategy is different.
It’s not based on a technical pattern that can be arbitraged away. It’s based on human psychology – specifically, the fact that fear, greed, and complacency are temporary emotions.
As long as humans are emotional beings (and I certainly don’t foresee that changing anytime soon), the VIX will continue to spike and revert, and we’ll continue to have opportunities to profit.
The beauty of this strategy is that it actually benefits from volatility. Most investors dread market turbulence. But once you understand how to trade the VIX, volatility becomes your friend.
Every geopolitical crisis… every economic surprise… every Fed announcement that sends the market into a tailspin…
These are all opportunities.
What’s Next?
You now have everything you need in order to understand my new strategy of trading the VIX and how it can transform your trading results.
Over the coming weeks and months, I’ll be sending you an alert each time our Z-score system triggers. You’ll get complete details on which UVXY options to buy, what price to pay, and when to exit.
My goal is to help you capture that 78% average maximum return per trade with an 80% accuracy rate, just as our historical backtesting suggests is possible.
Some trades will be home runs. Others will be singles. A few will be strikeouts.
But if we execute this strategy with discipline, the math is firmly in our favor.
I’m excited to have you on this journey with me. Keep an eye on your inbox for the next trade alert, and don’t hesitate to reach out to mailbag@oxfordclub.com with any questions.