
The World Record Pattern: How to Target a 69% Gain Every 39 Days
When I first encountered this incredible pattern, I was stunned!
“It can’t really be that simple,” I told myself as I saw chart after chart revealing the undeniable truth. The evidence was clear as day and impossible to ignore.
This unique chart pattern has a proven record of signaling high-profit trade setups with very low risk in a short time span.
It’s so effective for earning huge windfalls – in some cases even doubling or tripling your investment in just a few months – that I’ve come to the conclusion that it’s the most profitable chart pattern in the world.
A big statement? Absolutely. But it’s backed by over 25 years of my personal research and professional experience as a successful trader and investor.
Nor am I alone. Legendary investor William O’Neil, founder of Investor’s Business Daily, called it “the strongest of patterns.”
That’s why it’s essential that you, too, become familiar with how and why this pattern works.
I’ve put together this short guide revealing how and why this chart pattern can grow your account faster than you ever thought.
So let’s get started.
The Bull Flag: Champion of Chart Patterns
The bull flag pattern is one of the centerpieces of Technical Pattern Profits. But what exactly is a flag pattern?
A flag formation is a chart pattern that acts as a “continuation” indicator for an ongoing trend. In other words, flag patterns are bullish when they appear in an uptrend and bearish when found in a downtrend.
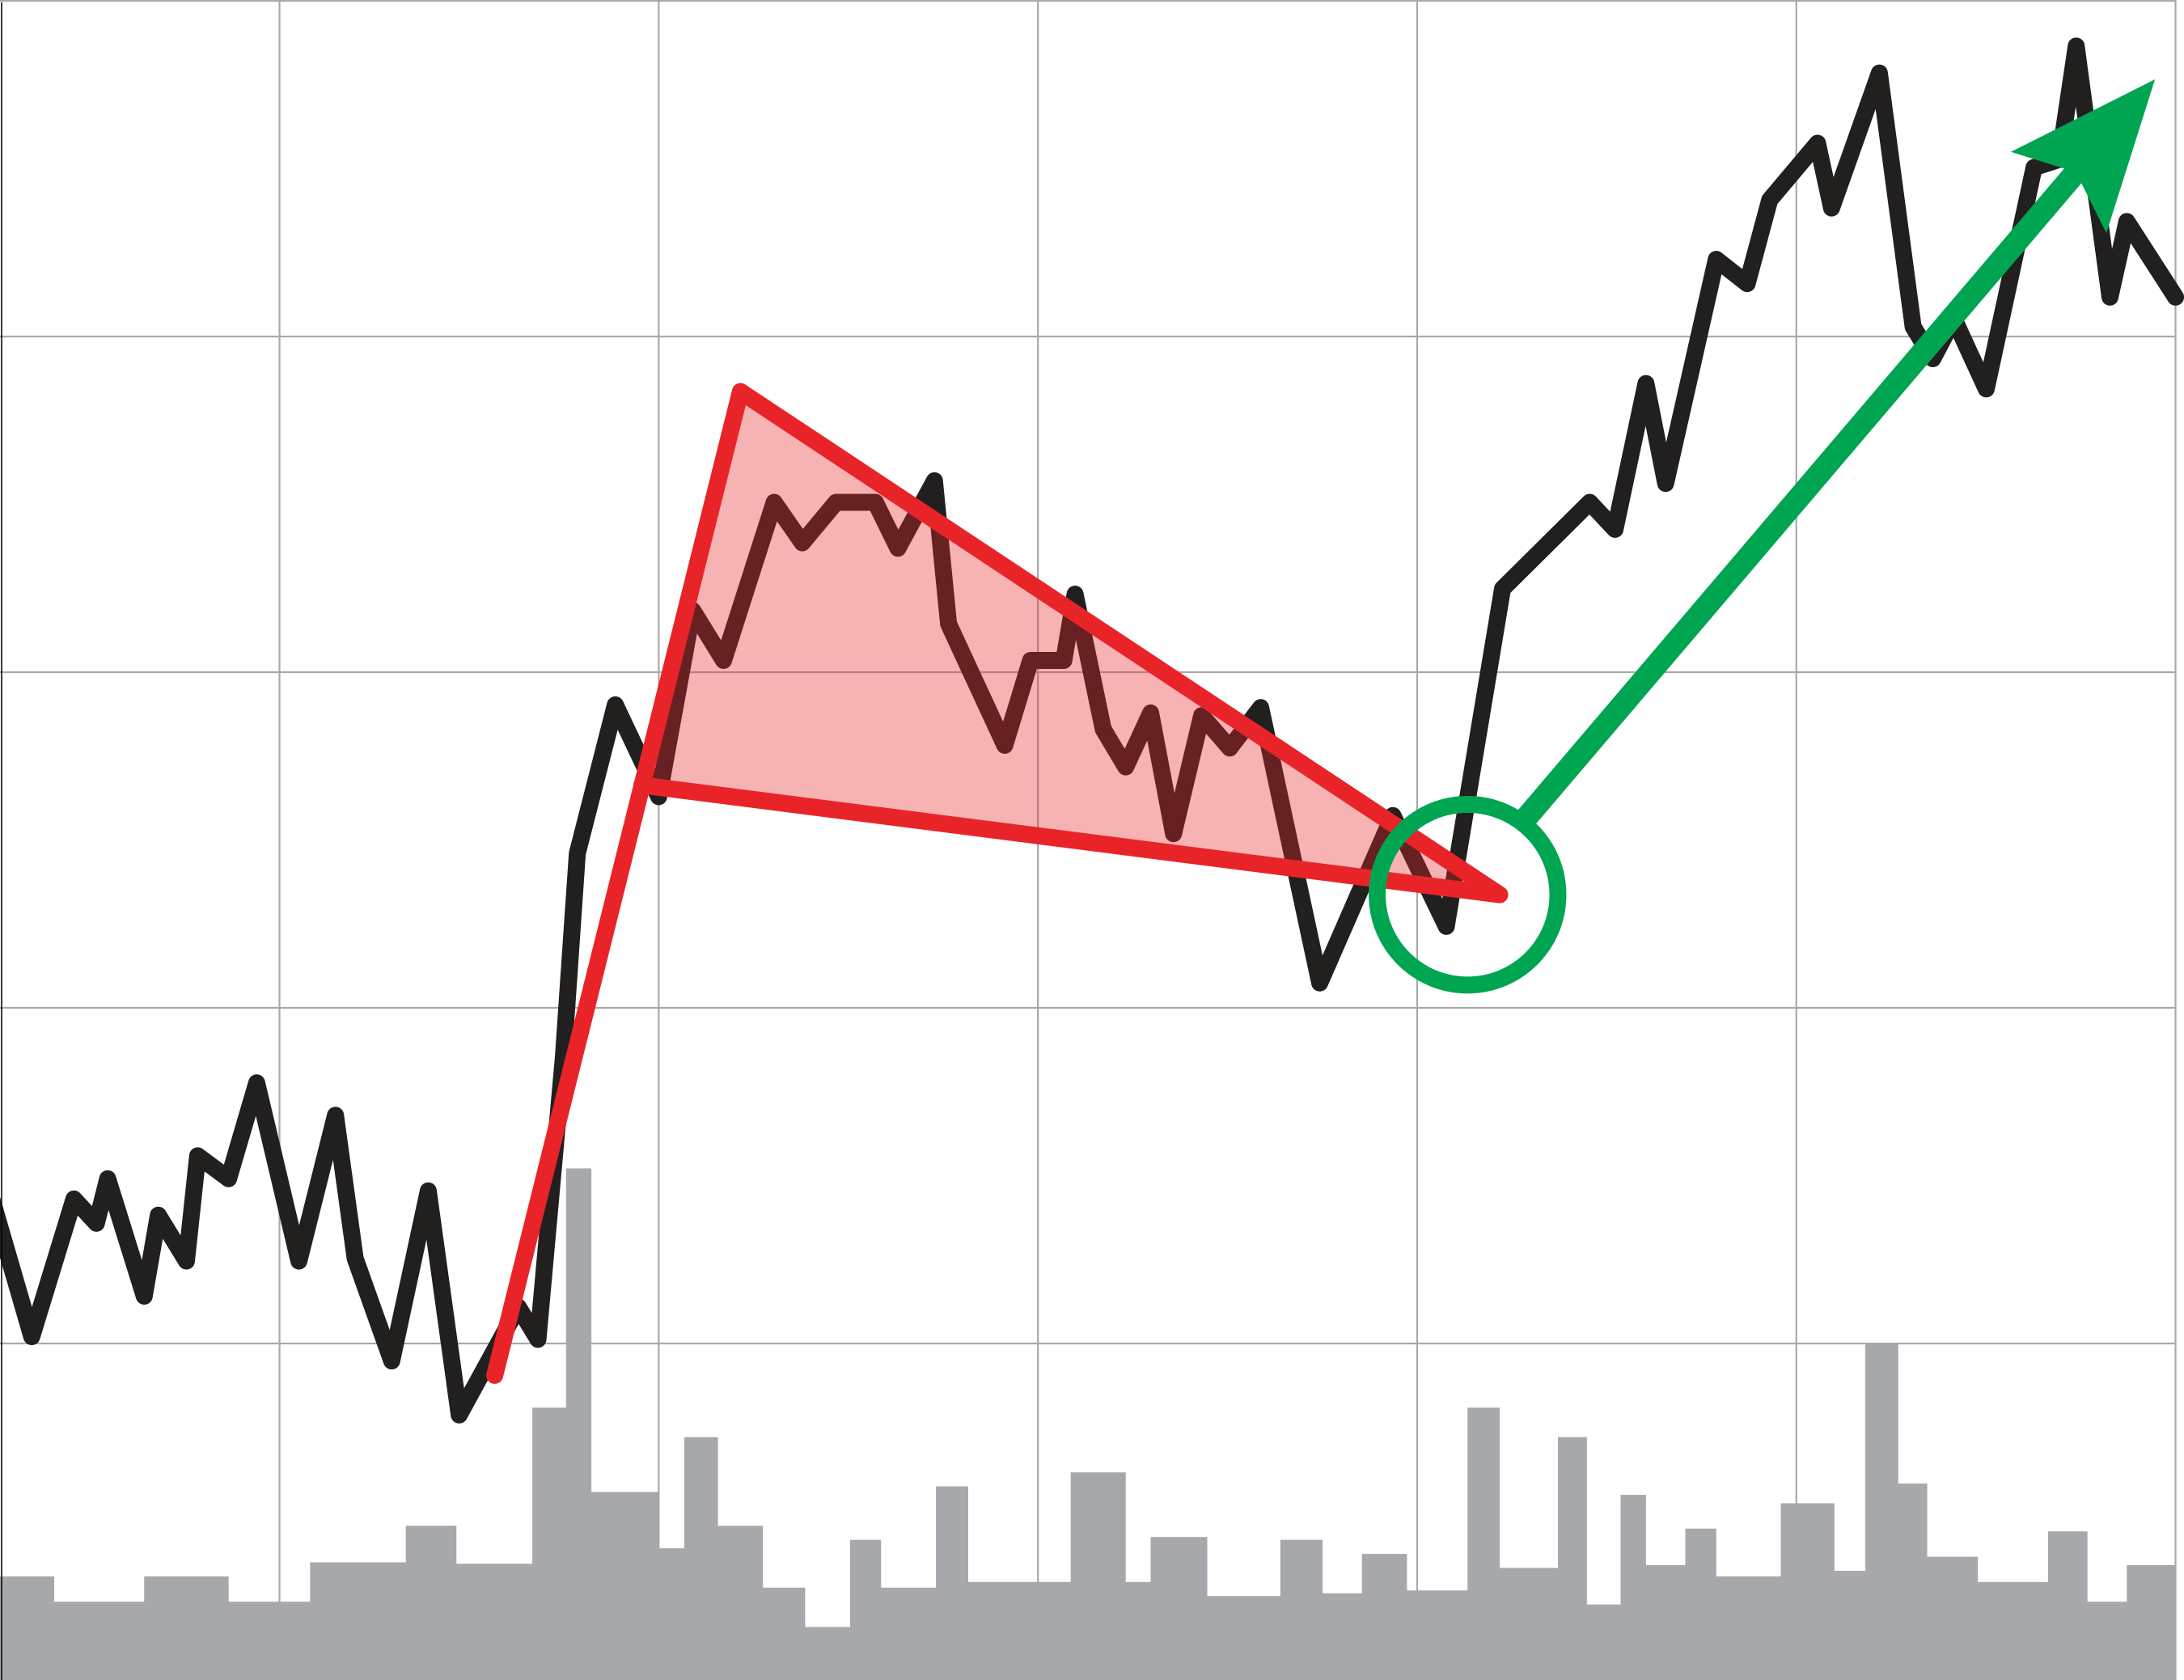
A flag pattern has four key stages: the flagpole, the flag, the breakout and the ultimate high…
Stage 1: The Flagpole
This is the first stage of pattern development, called a “flagpole.” (Some people call it a “gap up.”) It typically appears as a sudden, sharp uptrend over a short period of time.
It is vital that the move is fast and not a slow rise over a long period of time. This type of dramatic rise can happen for any number of reasons.
The spike could be triggered by a biotech company that received FDA approval. Or perhaps it comes after a major earnings announcement. It could even come after a company lands a merger deal or has a new product launch.
Whatever the cause, this is the first thing we look for… a major move upward in the stock price.
Here is an example from a stock called Energy Recovery Inc.
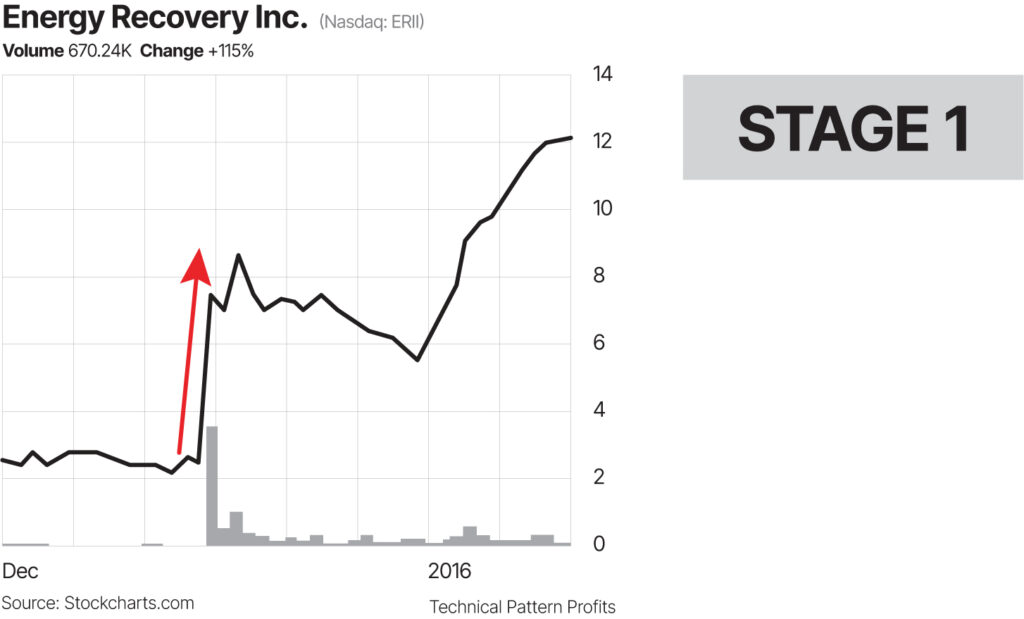
This company’s stock had quite a climb on heavy volume and rose by $6.
When an upswing stops, we look for Stage 2…
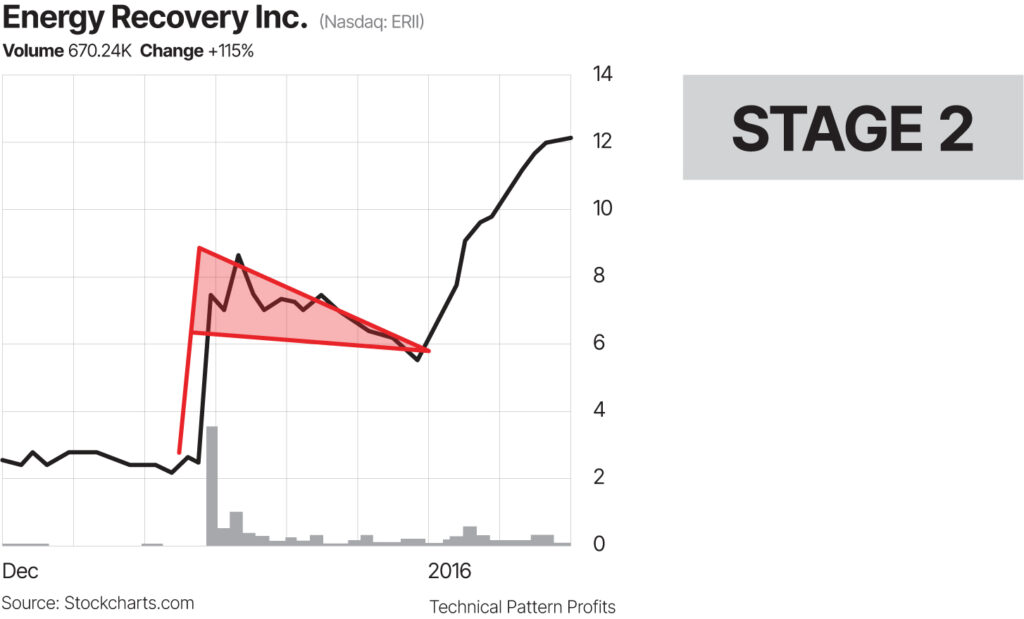
Stage 2: The Flag
The second stage of pattern development involves the price action beginning to consolidate or cluster within a downtrending trading range on much lower volume.
The buyers want to consolidate their recent gains and allow for a minor correction lower. And many traders don’t want to jump in at the top. They want to see the stock pull back a bit. The temporary pause is rather short (usually just days to weeks).
While a typical bull flag pattern will have trend lines that remain parallel to form the flag pattern, sometimes these flags form in the shape of a pennant, with converging trend lines that come together to form a point (a triangular shape) as the price range narrows.
Over a period of about two weeks, Energy Recovery Inc.’s stock price moved very slowly up and down until it settled at just under $6.
I get really fired up when I see the “World Record Pattern” form. I know big profits could be ahead, and I start to watch the stock extremely closely.
At this point, bulls are full of confidence and pumped to extend the trend higher.
But smart investors following a flag pattern wait for the next stage to take place before entering the long trade. You want to make sure to protect yourself from a potential reversal, as a consolidation sometimes results in a change of direction for a trend instead of a continuation.
The next stage we want to enter is the breakout… and then we get ready to strike.
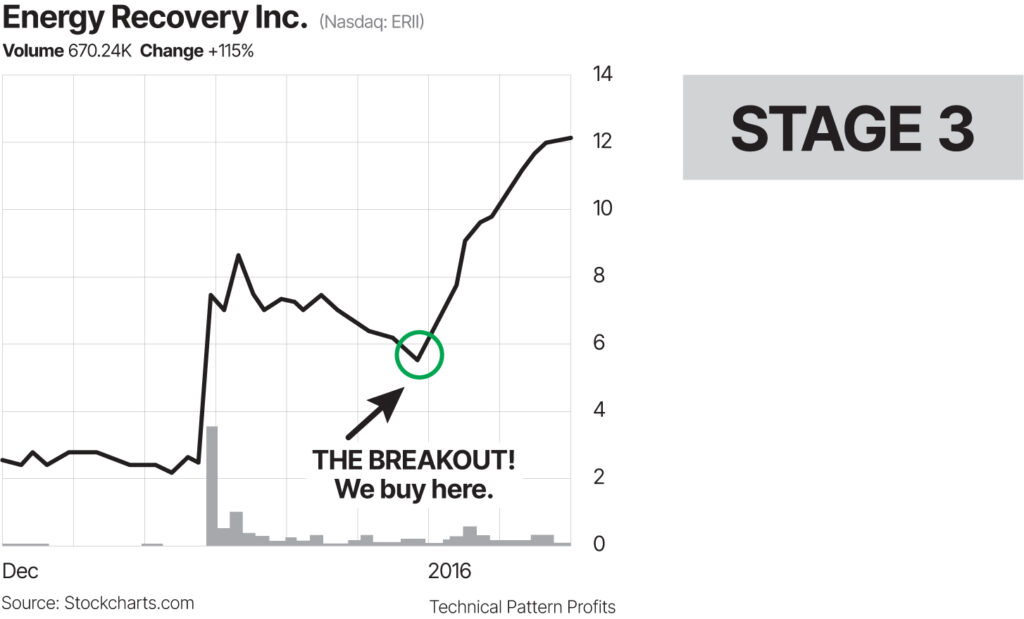
Stage 3: The Breakout
Here we wait for the right moment, known as “the breakout.”
This happens when all those traders who have been waiting for a price dip decide to rush back in…
Volume spikes… sending the stock rocketing to the moon.
Sometimes traders wait for the price to rise above the height of the flagpole as a confirmation of the breakout. I specifically look for buying activity to double the volume.
That’s our breakout.
And when the “breakout” hits, we buy.
Which brings us to our final stage…
Stage 4: The Ultimate High
The ultimate high is a specific target equal to the move of the original flagpole. I love that our exit is not something we are going to guess at.
For instance, since we know Energy Recovery Inc. rose by $6 during Stage 1, we know it should also rise $6 on its climb to the ultimate high.
And that’s exactly what happened.
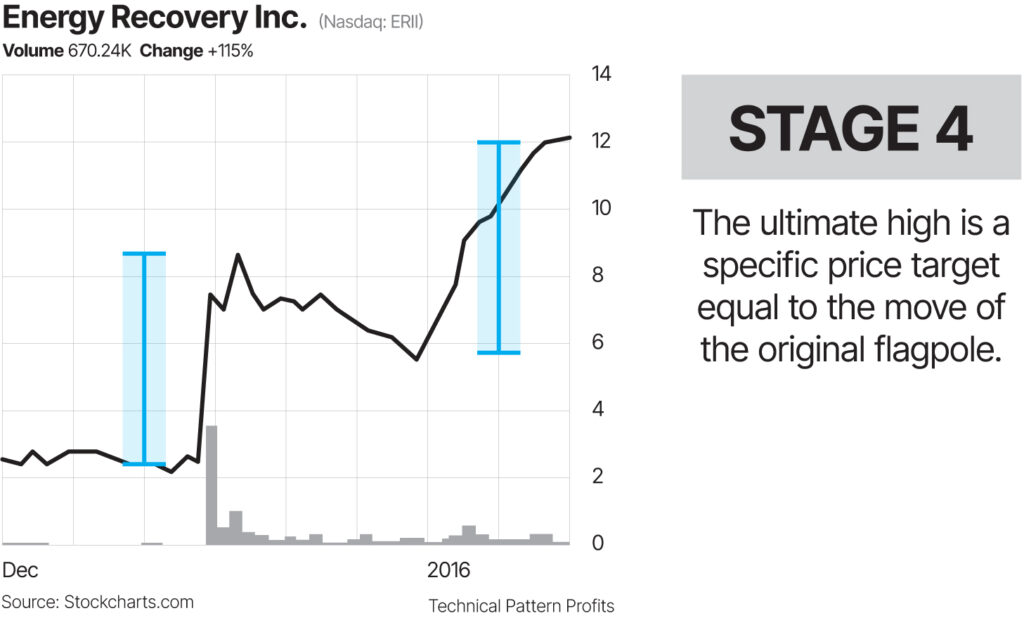
As you can see, after the breakout, the stock goes from $5.57 to the ultimate high of $12.09 in just two months.
That’s a sweet gain of 117%.
Follow a “World Record Pattern” a few times a year, and your portfolio will never look the same.
Why Flag Patterns Develop
You may be wondering why this pattern forms the way it does.
Like most price actions in the stock market, this one comes down to crowd psychology.
When a stock’s price rises significantly in a short time span, traders who have managed to hit it big will begin to take profits.
The short-term selling pressure leads to a temporary pause in the uptrend as profit takers begin to exit the market and new bullish traders hoping to buy on the dip start coming in.
This is the consolidation period, when the trading range occurs. The new traders effectively replace the profit takers and maintain bullish demand for the stock to rise.
In other words, the back and forth of bullish traders buying at bargain prices and bearish sellers taking profits forms the trading range.
Once enough sellers exit the market, the trend can finally break through above the trading range and continue the uptrend.
As you can see, crowd psychology plays a crucial role in driving this pattern to completion. But it’s not just a matter of theory. As I pointed out earlier, this pattern has a proven record of forecasting huge profit opportunities with relatively low risk.
In his extensive study of chart patterns in the stock market, Thomas Bulkowski – a veteran technical analyst and highly successful trader – found that, in bull markets, stocks showing a bull flag pattern generated an average rise of 69% in around just 39 days!
And in bear markets? He found the average gain was 42%!
Not only are those profits insane for such a brief time span, but there also wasn’t a single instance where he found this pattern didn’t lead to at least a 5% rise in the stock.
The flag pattern is so effective that even Jesse Livermore – regarded by many as the greatest stock trader of all time – was known to short stocks using this pattern during the Great Depression.
With all this evidence to back up the power of the flag pattern, you’d imagine that every trader in the world would devote themselves to the strategy.
But the truth is very few make money on it.
Why? Because too many traders lack the patience and discipline needed to take advantage of these unique technical chart pattern opportunities… and even fewer are prepared to utilize them with an exact plan.
So let’s go over our plan for successfully trading it.
Max Out Your Profits; Reduce Your Risk
With any trading strategy, it’s important to put risk management first. That means knowing exactly how much you’re willing to lose before you enter an investment.
My recommendations will always favor high-reward, low-risk setups.
I’ll only look for trades that offer at least a 2-to-1 reward-to-risk ratio, and preferably 3-to-1. That means if I’m willing to risk five points on a stock, I have to have a price target that is at least 10 points higher, if not 15.
For example, let’s say a stock is currently in a bull flag formation and we enter the trade at $20. Based on our analysis of the trend, we’ve determined a price target of $35.
For our target reward of $15 per share (a gain of 75%), we would typically risk no more than $5. That means we’d set our sell stop at $15 ($5 below our entry price).
And if our trade performs as expected and the stock price rises to $35, we either take profits immediately or secure our gains by raising our stop and letting our position continue to run.
As I said earlier, we want to know exactly how much we’re risking and how much we could potentially profit BEFORE we enter a single trade. Keeping a strict stop policy in place is what makes our trading strategy low-risk.
The beauty is that this strategy is both incredibly simple and highly effective. Yet so few have the skill and experience to recognize these trade opportunities when they arise.
Fortunately for you, you’ll have me to guide you through each trade so you can achieve these profits for yourself.
Now that you’ve got a keen sense of this strategy’s ins and outs, it’s time to put it to work.
When you receive your next Technical Pattern Profits alert, simply follow my instructions for executing the trade… and you’ll be well on your way to using this incredibly underappreciated trading tool (and other effective patterns too) to take home big gains from the market!