Have We Hit Rock Bottom?
From the Baltimore Clubhouse – In his book Extraordinary Popular Delusions and the Madness of Crowds, 19th-century author Charles Mackay wrote…
We find that, like individuals, [nations] have their whims and their peculiarities, their seasons of excitement and recklessness, when they care not what they do.
We can easily replace “nations” with “market participants” or “stock market investors” here.
I’ve recently noted that there is a wide-scale dissonance taking place in the markets that has led to a recent sell-off in stocks.
On the one hand, investors are gripped by fear that has led them to hurl stocks to the wayside. On the other, fundamental analysis reveals that much of the market is performing quite well.
This is something I covered in part last week, when I looked at how historically high volatility often signals a higher future rate of return on stocks.
As such, today’s high volatility could indicate that this is an opportune time to buy – not sell.
But today I’d like to go over another unique indicator. Because right now, it’s telling investors something extremely important…
The Goldilocks Indicator
During the late 1970s, J. Welles Wilder introduced several new – and still popular – technical analysis tools to help traders profit from trend (and trend reversal) signals in the market.
Wilder’s brilliance created a new frontier in technical trading. Traders use his techniques to this day.
But among the tools outlined in his seminal work, perhaps the most simple – yet effective – is the relative strength index (RSI).
RSI tracks the underlying momentum in a stock’s price action. Its value swings between 0 and 100.
But there are two key values that determine whether a stock should be bought or sold.
According to common usage, stocks with an RSI value above 70 are considered overbought or overvalued. Stocks with an RSI value below 30 are considered oversold or undervalued.
Most traders interpret oversold to mean that you should start looking to buy the stock (assuming you’ve already done your due diligence in researching the company’s fundamentals).
Likewise, overbought means it’s time to think about selling.
I often call RSI the Goldilocks Indicator, because it tells me whether a stock’s momentum is too hot, too cold or just right.
As a momentum indicator, RSI is best viewed as a signal that grabs your attention before buying or selling a stock.
Even better, it can serve as a sentiment gauge for the broader market.
RSI is my favorite technical indicator. It’s simple and reliable when applied in the right context.
It helps us answer this question: Is the market overbought or oversold?
The Verdict Is…
Most traders apply RSI to the daily price actions of individual stocks and indexes. But I prefer to take a long-term view of the market in situations like these.
So I use weekly RSI. This provides fewer – and therefore more urgent – overbought and oversold signals over the same period. It also helps to reduce the noise that goes with daily price fluctuations.
Below is a weekly price chart of the S&P 500, including its 14-week RSI at the bottom.
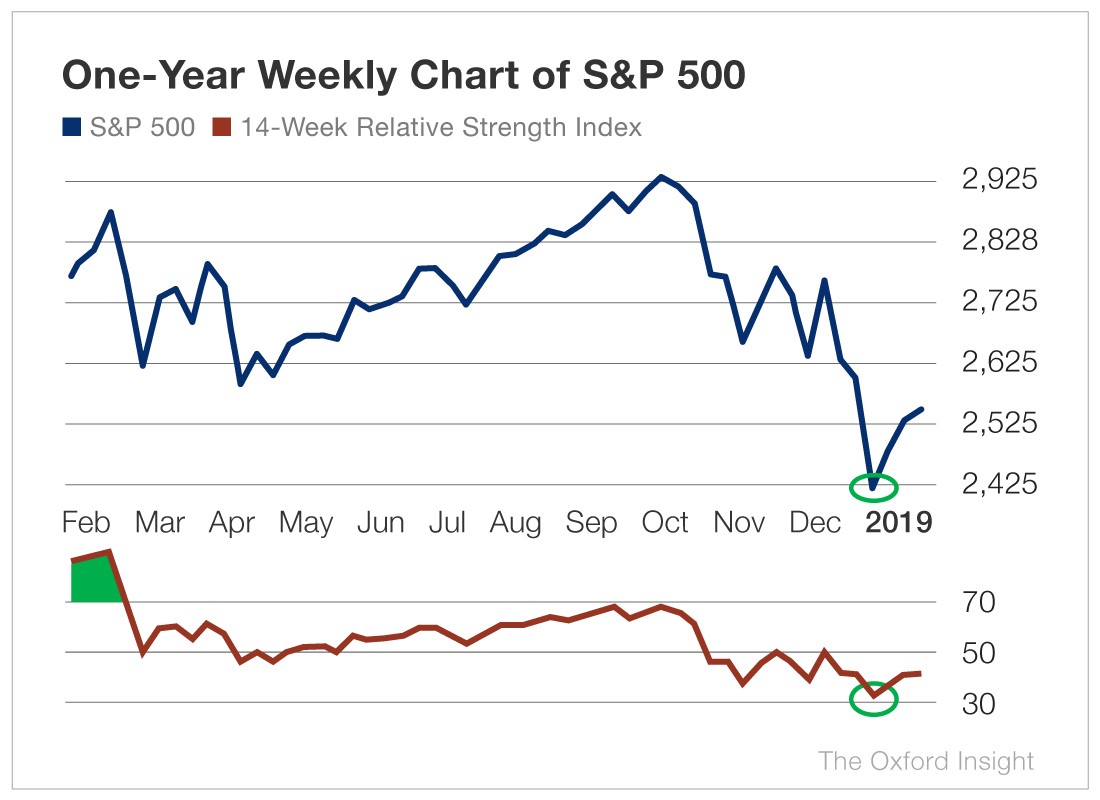
In early 2018, the market reached overbought levels before entering a short-term correction. Twice last fall, the market rebounded and lost steam as RSI touched the 70 level.
And recently RSI reached 31.47… dangerously close to 30, or oversold territory. Stocks have already begun to rebound from that level.
This leads me to the most important lesson in today’s article…
Touching or dropping below 30 is a strong indication that we’ve reached a bottom.
Over the past 10 years, this pattern has signaled a subsequent rebound every time.
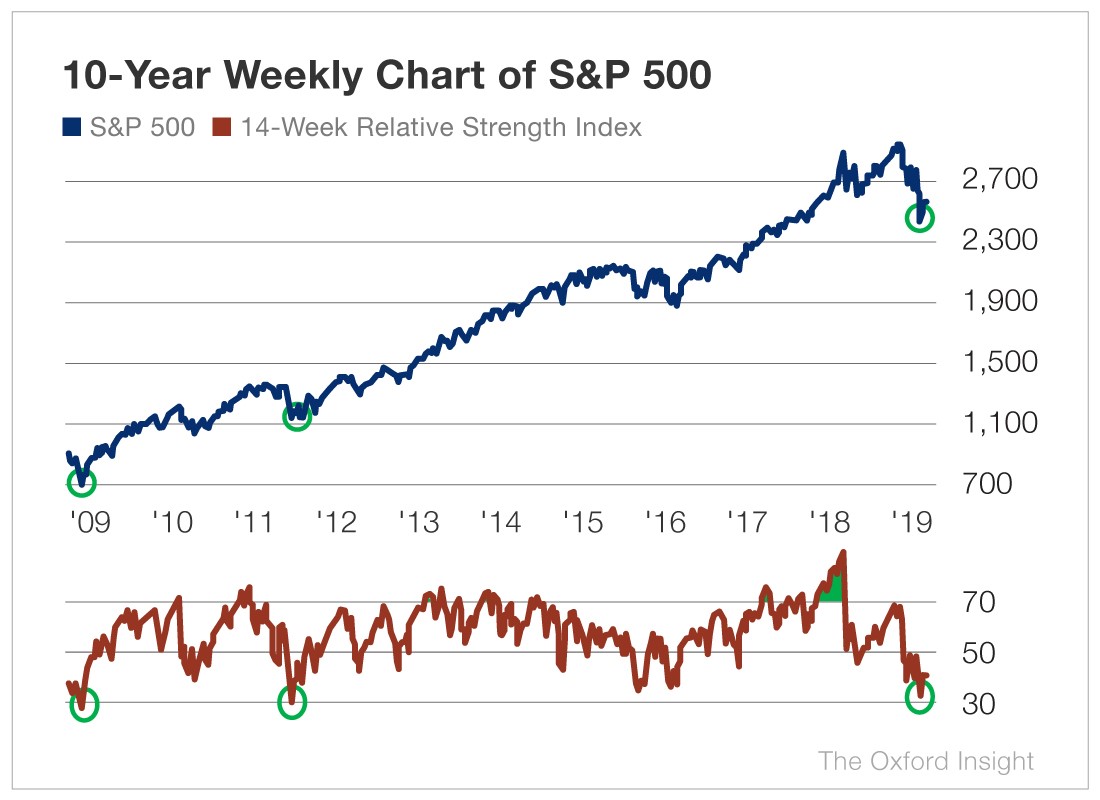
Of course, seeing RSI actually break below 30 is a confirmed indication of the market being oversold. But this is not always needed for a rebound to begin.
The point is there’s no reason this bull can’t keep running. Based on what we’ve seen historically from RSI, the market could soon see a strong rebound.
This indicator should help alleviate the dissonance we’ve seen over the past several weeks. The fundamentals and the technicals are saying it’s time to buy into this market – specifically into value and long-term growth opportunities.
Good investing,
Anthony